Among the Sentinels satellites that are currently in orbit, Sentinel 3 is surely the one carrying a set of cutting edge instruments that will capture scientific data about the Earth’s oceans, land, ice and atmosphere. It can be really interesting to look at a very specific sensor included in the Sentinel 3 payload, called Sea and Land Surface Temperature Radiometer (SLSTR) that can measure global-sea and land-surface temperatures with an accuracy of better than 0.3 K. The measurements provided by this instrument have a spatial resolution of 500 m for visible/near-infrared bands and 1km for thermal infrared channels. These specifics have been carefully considered to obtain the two following images.
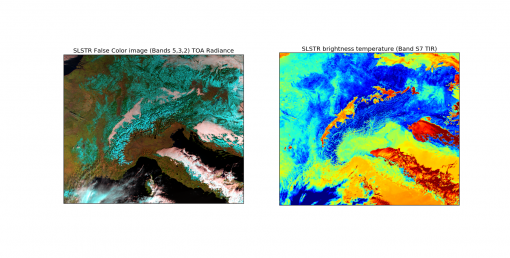
Python image processing results for a Sentinel 3 SLSTR product
The image processing in this case has been implemented in Python, exploiting the advantages provided by the SNAP toolbox and its API that have been described in detail here , where it is also described how it is possible to install and use it properly.The image on the left has been obtained as a combination of the data from three different bands. Each of them provides a measurement of the radiation captured by the sensor in a definite portion of the electromagnetic spectrum. The result is a so called False color image, meaning that the scene is depicted with colors that are different from the ones that could be seen by a person with his own eyes. Anyway this kind of image can provide useful information to the scientists engaged in the activities of vegetation monitoring and cloud characterization.The spatial resolution is 500 m and it means that two different features in the image could not be distinguished if they were closer than 500 m in distance. For the second image the resolution goes to 1km ,so the quality of the details is not the same even if it is not easy to notice that at first sight.
If compared with the image on the left, the one on the right denotes a different color composition that aims to underline another type of measurement implemented by SLSTR. In this case the processed data come from a single band of the sensor that is called Thermal Infra-red band and it can determine the sea and land surface temperature. Anyway what is captured and represented in the image is not the real temperature on the surface, but the brightness temperature that is directly related to it.The captured data have been specifically processed to represent the lowest temperatures with a dark blue color and while the highest temperatures are have been depicted in red.
The two results provided here are just a small and quite basic example of the processings that can be implemented with the Sentinel 3 products and it is worth underlining that the usage of the SNAP toolbox can produce much more complex and detailed scientific analysis.
Feature Image: ESA